The Arctic is generally associated with a cold, extreme climate. We all know that temperatures up there differ tremendously from those typical of Europe. While in Poland it is not uncommon for summer temperatures to reach 30°C, in Northern Canada they usually hover around 8–10°C. In winter, the Polish norm is about -5°C, while in Greenland even -40°C raises no eyebrows. In recent years, however, the contrast is gradually becoming less striking. Although climate changes affect the entire globe, nowhere are they as dramatic as on its northern outskirts. The Arctic is warming up faster than the rest of the world, which has long caused serious concern among scientists. Let us therefore have a closer look at the underlying mechanism of this phenomenon and its possible consequences.
One way to measure the intensity of climate changes is to compare the mean temperature from a given multi-year period (say, thirty years) with the mean temperature from a preceding multi-year period. The method is very straightforward. All we need is to get temperature records for a selected time period from all over the world, calculate the mean value, repeat the procedure for an earlier period, and subtract one value from the other. What we end up with is a single number, which is easy to grasp even for non-scientists.
In a nutshell, this is how „climate targets”, which we hear about so often, come into being. By stating that “we must not allow for global warming to exceed 2°C” we mean that “we must not allow for global mean temperature in the future to be higher by more than 2°C than the global mean temperature in the past”.
As is usually the case, however, the price to pay for making the message easy to comprehend is gross oversimplification. When calculating the global mean change in air temperature, we bring the world’s immense biodiversity and all the many ways in which it can and does react to climate changes down to a single number. So let us now try to bring the diversity back by calculating the mean temperature change separately for different places in the world. What we get as a result is the following map:
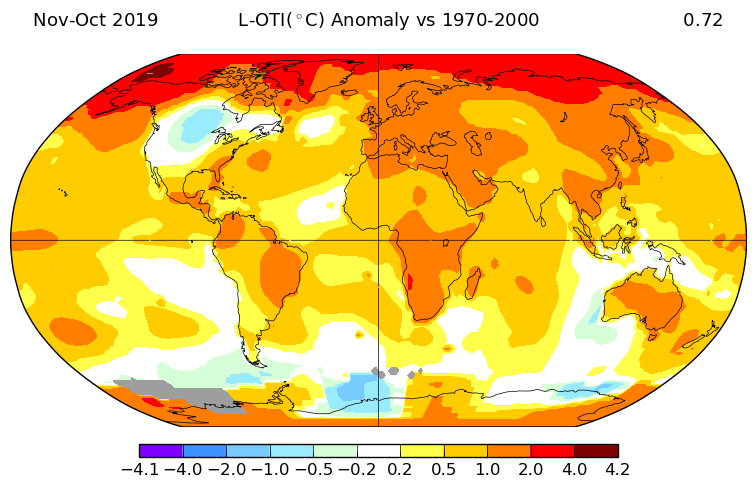
The difference between the mean temperature in 2019 and the mean from the years 1970–2000. The map was generated on https://data.giss.nasa.gov/gistemp/maps/index_v4.html. Visit the website and play with various parameters to see how the process of global warming affects the world and your country.
The darker the colour the greater the increase in mean air temperature in the area. So what is it that strikes us the second we look at the map? The Arctic, which in terms of the cold is second only to the Antarctic, warms up the fastest.
The phenomenon of intensive warming in polar regions is known as polar amplification. These days, the amplification occurs mostly in the vicinity of the Earth’s North Pole, which is why the term “Arctic amplification” is often preferred. Its intensity is considerable. While the global mean temperature increase in the years 1970–2000 was approximately 0.7°C, in the Arctic the mean temperature rose by over 2°C. What is the reason behind this disproportion? The most convincing explanation links polar amplification to the rapid reduction in the extent of sea ice. To put it simply, the mechanism works as follows:
When the climate becomes a little warmer (due to, for example, the emission of anthropogenic greenhouse gases), it is followed by an increase in the amount of sea ice that melts in the Arctic Ocean during the polar day. During the polar night, which is to say – in winter, the ice cover builds up at a slightly slower rate and does not therefore reach the same extent as it did the year before. This means that parts of the ocean which used to be covered in ice remain ice-free throughout the year, a fact has a profound impact on the temperatures in the Arctic. Sea ice is white, which means that it reflects a vast majority of solar radiation. Sea water, on the other hand, is dark and, instead of reflecting the radiation, it absorbs much of it and thus becomes warmer. Warmer waters freeze less readily, so in the following year the extent of white sea ice is even smaller and the surface area of dark sea water – bigger. Consequently, more radiation is absorbed, which makes the water even warmer. And so it goes on year after year
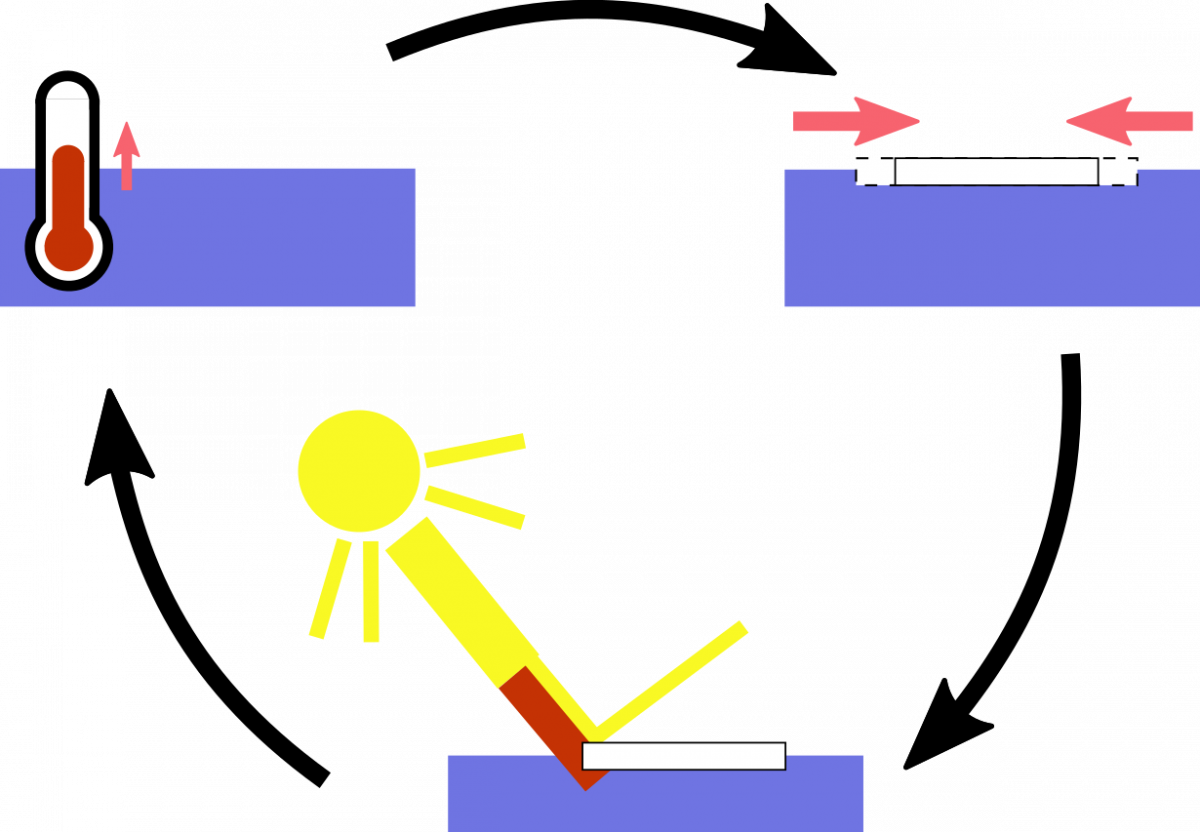
The diagram shows the positive feedback loop, or the „vicious circle” effect, which speeds up the warming of the Arctic. An increase in temperature makes sea ice melt. This leads to the uncovering of dark ocean surface, which absorbs more radiation and thus leads to a further increase in temperature.
This self-perpetuating cycle is referred to as a positive feedback loop. The vicious circle of ice loss and ocean warming is generally considered to be the main cause of Arctic amplification. It is not, however, the only one. Higher temperature of ocean water boosts evaporation. As a result, the atmosphere in the Arctic becomes richer and richer in water vapour, which is the most common of all greenhouse gases found in Earth’s atmosphere. The heat from the atmosphere is transferred to the ocean, which further accelerates the rate of ice loss. At the same time – contrary to what happens, for instance, around the Equator – air circulation in polar regions “traps” the air. In the tropics, storms lift the heat and water vapour to higher layers of the atmosphere, from where it is carried off by the winds and dispersed around the globe. An increase in evaporation at the Equator leads to a corresponding increase in the frequency and intensity of storms that sweep through the area. A mechanism of the sort, which helps to disperse excess heat, is missing in the Arctic. Storms are a rarity in the far north, and – to make things even worse – growing amounts of water and heat are transported to the area from the tropics.
If the intensity of climate changes depends on the location, does it also depend on the season? An attempt to answer this question was made by Polish scientists – Prof. Marzena Osuch and Dr Tomasz Wawrzyniak from the Institute of Geophysics, Polish Academy of Sciences. Their academic article from 2017 [1] deals with climate variability along the western coast of Spitsbergen. The scientists checked if the change in mean temperature measured at the Polish Polar Station Hornsund is the same or different on particular days of the year. One of their results can be seen in the chart below:
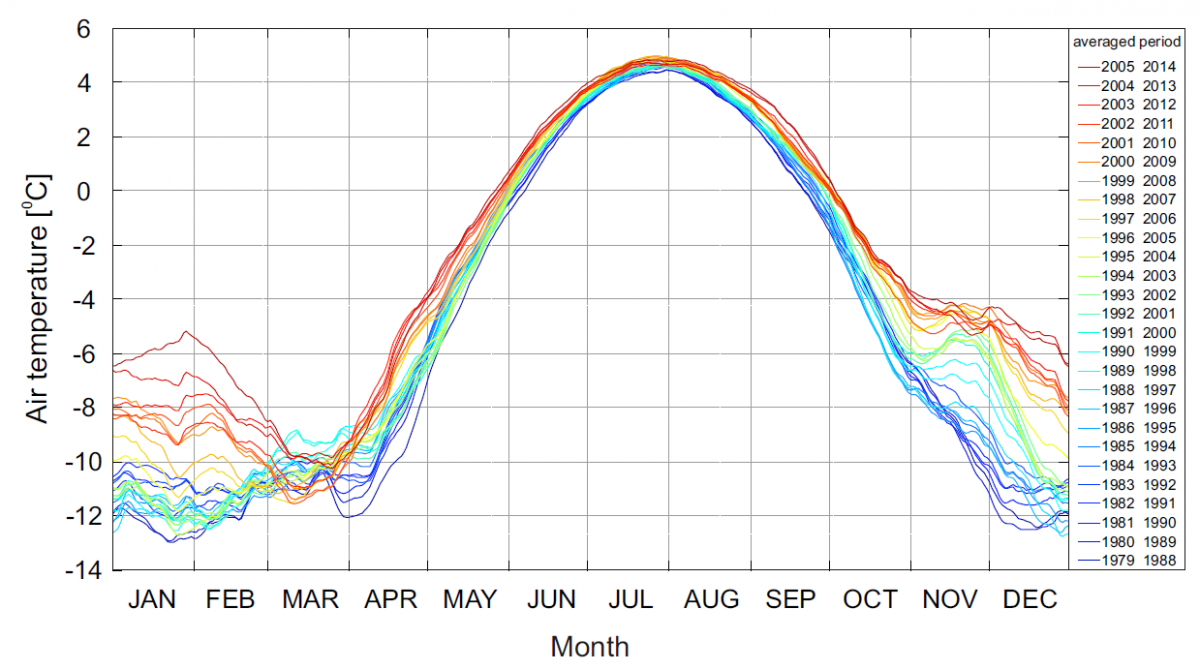
Changes in the mean daily air temperature at the Polish Polar Station Hornsund. Chart based on [1]. The data were averaged in two dimensions over a shifting time horizon. The final value for each day of the year was calculated on the basis of the mean value from a multi-year period (which is to say, the mean value recorded on a given day over ten consecutive years) and from a 30-day period (the mean value recorded on a given day as well as on 15 days before it and 15 days afterwards). For example, the value for 16 Jan 2014 was calculated on the basis of the mean temperature recorded on 16 Jan in the years 2005–2014 and the mean temperature from 1–31 Jan 2014.
Each line in the chart illustrates an averaged temperature recorded over a decade, with each decade starting in a different year (e.g. 1988–1997, 1989–1998, etc.). The cooler the colour of a line, the more distant the past it represents. Looking at the chart, it is easy to see that the temperatures increased in all months of the year, but the biggest increases were recorded between November and February. From March till mid-October, differences in air temperature between particular periods are very slight. In autumn, the lines start to diverge to reach maximum divergence in December and January. But what does it mean in practice? Climate warming is a lot stronger in winter than it is in summer. As a result, the coldest month in Spitsbergen is no longer January or December, but March. This situation is a direct consequence of the positive feedback loop described above. Ice loss plays a particularly important role during the cold season, when the ocean, instead of freezing over, returns to the atmosphere the heat it absorbed during summer.
Should we view polar amplification as a mere geographic curiosity or a factor that has the power to affect our lives?
There is no agreement among scientists regarding the potential impact of the violent warming of the Arctic on regions located further south. Some models indicate that changes in the far north disturb atmospheric circulation, causing severe droughts and devastating floods [2]. Other research suggests that such extreme weather phenomena are a consequence of very different processes (such as changes in the temperature of tropical oceans), and polar amplification plays second fiddle, if that, in the shaping of climate in Europe, USA and Siberia [3]. There is no doubt, however, that the rapid warming of the Arctic exerts a profound impact on the Arctic itself, destabilizing not only natural local ecosystems, but also the daily lives of its human inhabitants. As a result, Arctic amplification should be kept in mind whenever the conversation turns to global warming.
Author: Julian Podgórski
The author would like to thank Prof. Marzena Osuch and Dr Tomasz Wawrzyniak for scientific consultation and constructive advice.
Translation: Barbara Jóźwiak